
Free Market prices
The Free Market front page now lists each item's median sold price, its change and a trend line. You can narrow the list by category, job and period.
The summary cards and price list
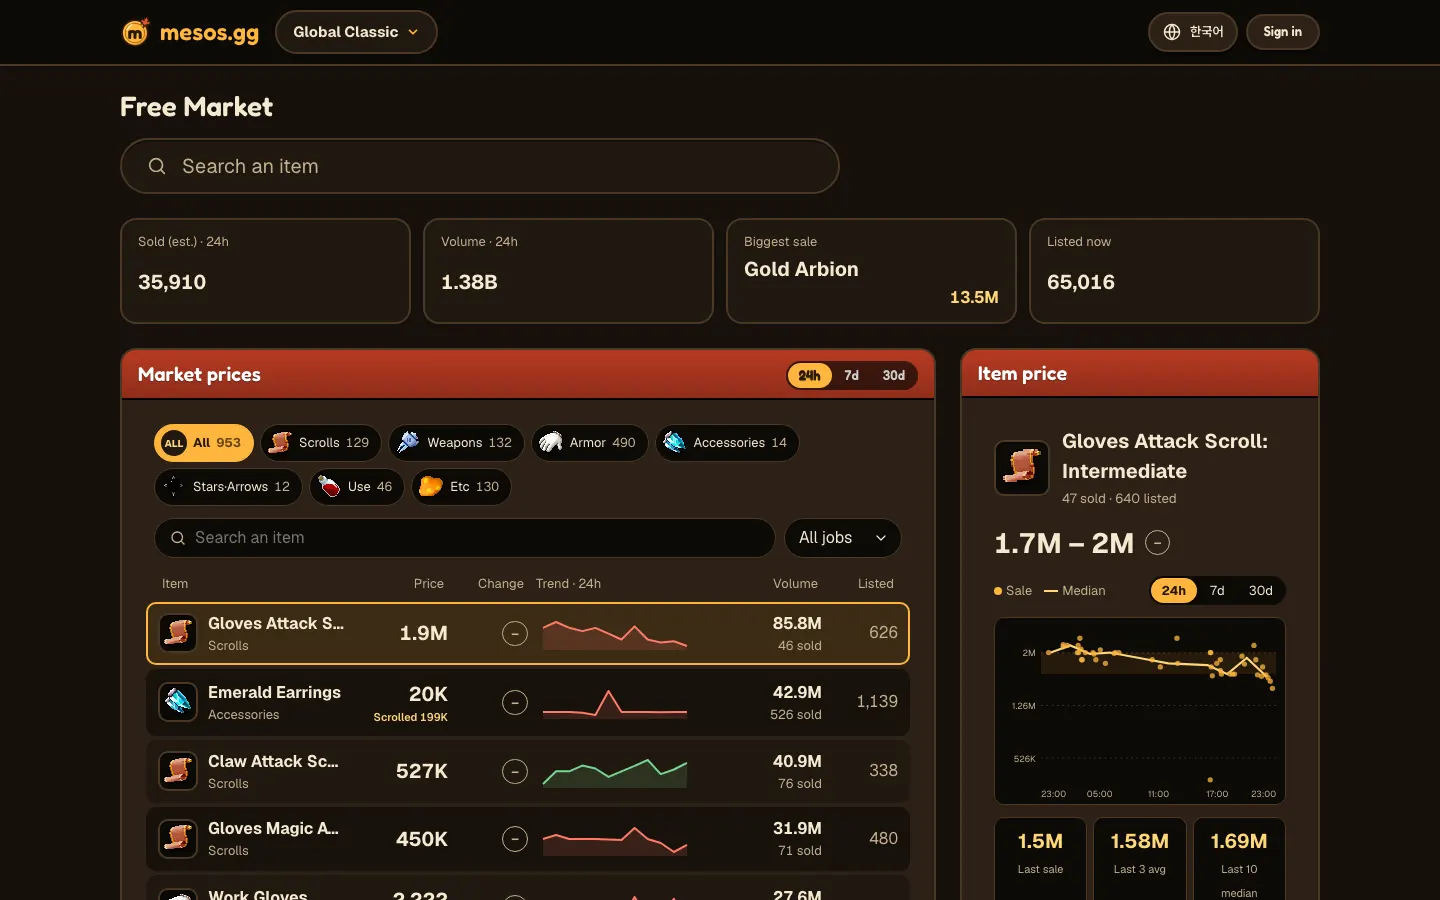
Across the top are four cards: Sold (est.), Volume, Biggest sale and Listed now.
The 24h view on the night of November 5 showed 35,910 sold and 1.38B mesos of volume. A Gold Arbion at 13.5M was the biggest sale, and 65,016 listings were up.
Biggest sale is the most expensive single sale in your chosen period. Listed now is the number of listings up right now.
Under the cards is the list, with the highest volume first. Every row shows the median sold price, change, a trend chart, volume with the sale count and current listings.
First on the list that night was Gloves Attack Scroll: Intermediate, at 1.9M with 46 sales, 85.8M in volume and 626 listed.
Change compares your period's median with the median of an equally long stretch right before it. With no earlier records, it shows a dash in place of a number.
Narrowing down by category, job and period
- Category: All, Scrolls, Weapons, Armor, Accessories, Stars·Arrows, Use or Etc
- Job: equipment is grouped by who can wear it, and scrolls by who uses the weapon they apply to
- Period: 24h, 7d or 30d
Each category has a count beside it showing how many items it holds. On November 5, Armor was the largest, at 490 of 953.
If you want one specific item, search for it by name. The 7d and 30d views fill up as more days get recorded.
The order you pick them in doesn't matter. Pick Scrolls and then Bowman under jobs, and the list narrows to scrolls for Bowman weapons.
Reading prices step by step
- Choose 24h, 7d or 30d above the list
- Click a category, plus a job if you want
- Click an item in the list to see its prices
- In the item panel, click See all for every shop selling that item
The item panel has separate period buttons, so the list can stay on 24h while you view one item over 7d.
One item's prices
Clicking an item opens its prices in a panel on the right. On mobile, the prices show at the top of the item page.
The row you clicked gets a gold border on desktop, and the right panel changes to that item.
The panel starts with the price range covering the middle 50% of sales, plus a sales chart with a median line. Below that are the last sale, the average of the last 3 and the median of the last 10. Sellers shows a few of the cheapest shops, and See all opens the full list on the item page.
For Gloves Attack Scroll: Intermediate, the range was 1.7M to 2M. Its last sale was 1.5M, the last 3 averaged 1.58M and the last 10 had a median of 1.69M.
Because the range sits next to the recent numbers, a quick look tells you whether the latest sale was cheap or expensive.
Each dot on the chart is a single sale, and the line is the median. Mesos go up the side, with time along the bottom.
Phone layout
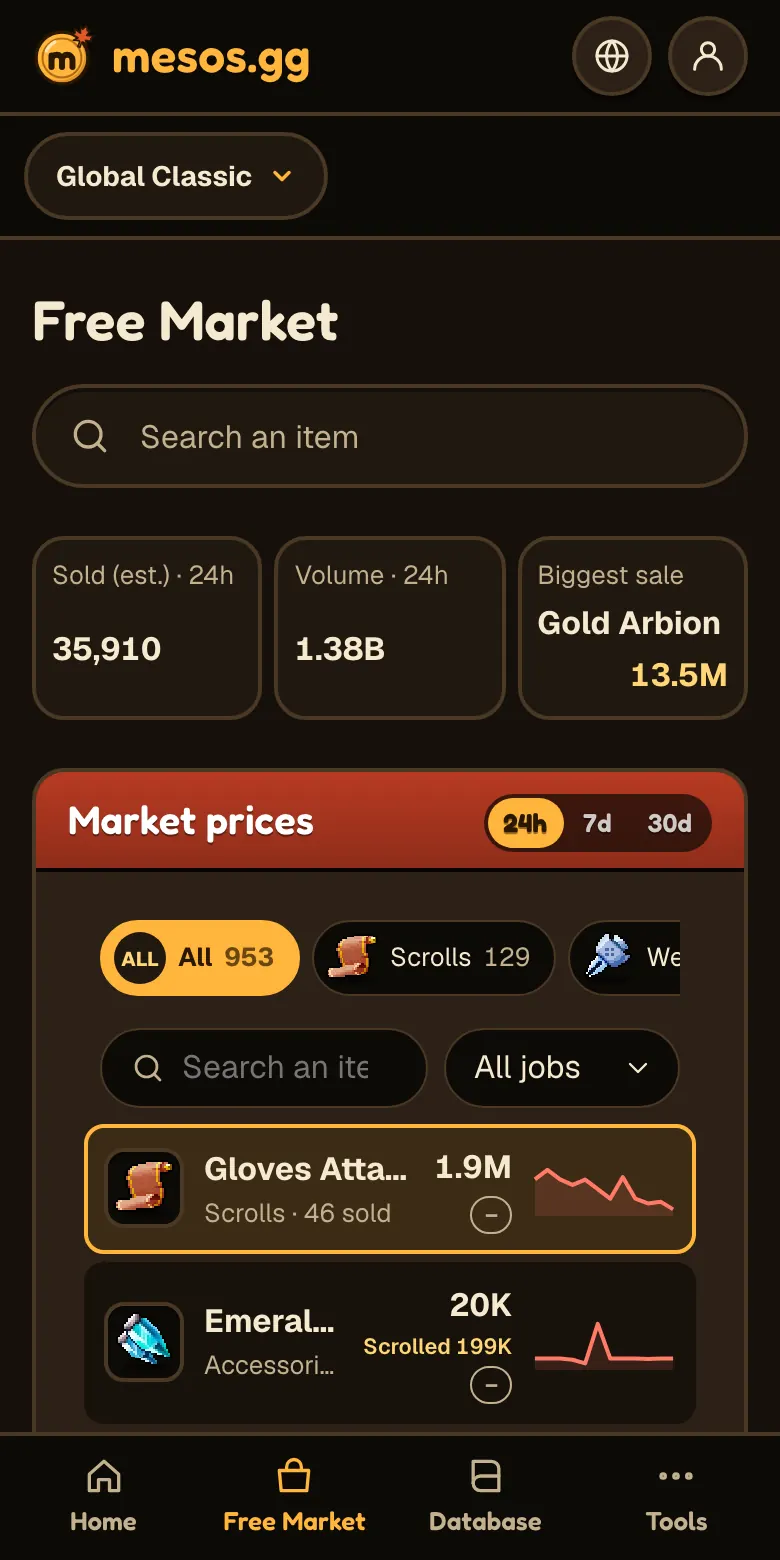
The cards shrink to three per row, and the Market prices list sits right under them. Swipe the category buttons sideways to see the rest.
Rows keep the price and trend chart, while the category and sale count drop under the item name in small type.
Tap an item to go to its item page, where the prices are at the top. To get back here from anywhere, tap Free Market in the bottom tab bar.
Equipment prices by upgrade count
Equipment price and change are based only on unscrolled sales. Underneath, in small type, Scrolled N gives the median for scrolled ones.
Emerald Earrings, for example, show 20K as the price and Scrolled 199K below it, so scrolled pairs went for far more.
Buttons like Clean, +1 and +2 in the item panel choose the upgrade count. Each recent sale and seller row shows its stat line.
How Sold (est.) gets counted
A listing counts as a sale when its quantity reaches zero, and so does a drop in quantity at the same shop and price. From outside, an owner taking an item back looks the same, so these numbers are estimates.
Because prices are medians, one or two unusually cheap or expensive sales barely shift them.
Questions
- Why does Price differ from Each on the item page? Price is the median of completed sales, and Each is what shops are asking right now
- I picked 7d and nothing shows up. 7d and 30d fill in as records build up
- The Change cell shows only a dash. That means there isn't an earlier period to compare with yet